
The late-January snowstorm that blanketed large portions of the U.S. is now clearly visible in national housing data. After showing only mild effects the prior week, housing activity pulled back across several key metrics, led by new listings and pending sales.
Even so, the broader market picture remains intact. Inventory growth is slowing, the share of homes with price cuts continues to improve year over year, and the Market Action Index (MAI) remains seller-leaning nationally, supported by mortgage rates holding near 6%.
“I was amazed that the last Housing Market Tracker didn’t show much drama from the epic late-January snowstorm that impacted much of the U.S., but today’s tracker data got hit for sure. However, the housing market will be back in full force again soon.”
National market snapshot
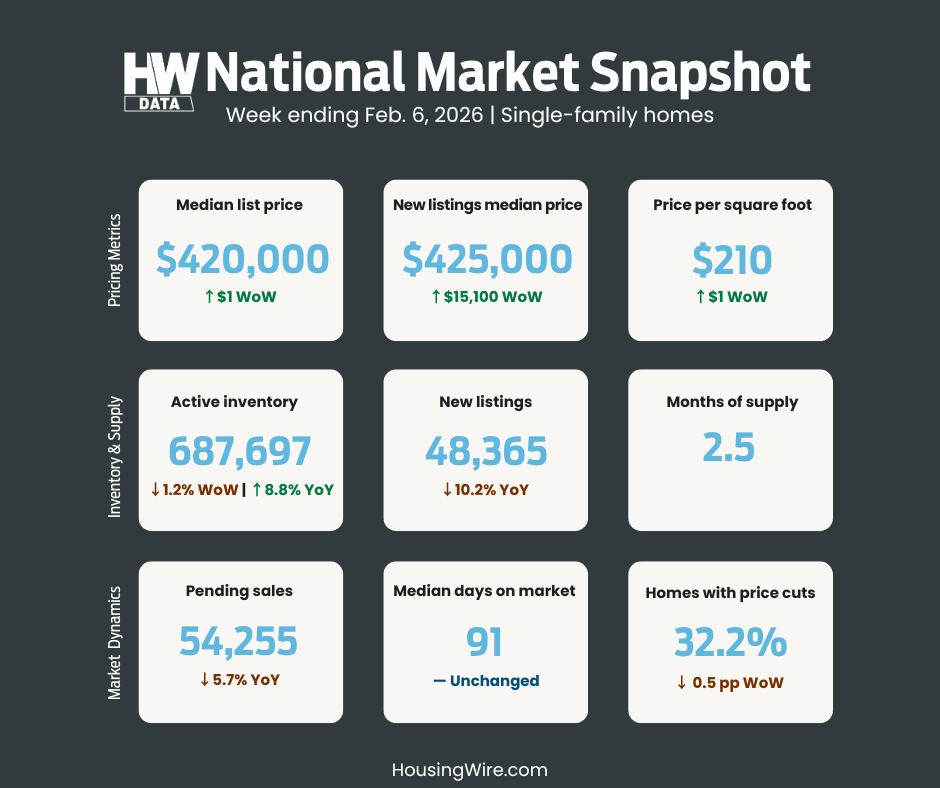
Key metrics as of Feb. 6, 2026 (single-family homes)
- Median list price: $420,000 (up $1 week over week)
- New listings median price: $425,000 (up $15,100 week over week)
- Average days on market: 91 (unchanged)
- Active inventory: 687,697 homes (down 1.2% week over week)
- Months of supply: 2.5 months
- Price per square foot: $210 (up from $209)
- Homes with price cuts: 32.2% (down from 32.7%)
- Homes with price increases: 2.3% (flat)
- Relisted homes: 11.0% (up from 10.8%)
- Market Action Index: 35.9 (up from 34.0)
Listings and contracts reflect timing disruption
The storm’s impact is most visible in new listings and pending sales — the two metrics that tend to move first when weather disrupts showings, inspections and seller timing decisions.
New listings fell to 48,365, down 10.2% year over year from 53,861. Because new listings represent the cleanest real-time supply signal, the pace of recovery over the next several weeks will be critical for shaping early spring inventory levels. A quick rebound would confirm a weather-driven pause. A prolonged decline would tighten supply heading into peak season.
Pending home sales declined to 54,255, down 5.7% year over year. Since pending contracts typically convert to closings with a 30- to 60-day lag, this week’s softness is likely to influence March and April transaction volume. The direction of mortgage rates will determine whether that dip proves temporary or extends further.
Inventory growth continues to decelerate
Active inventory declined from 696,222 to 687,697 homes, a 1.2% week-over-week drop. On a year-over-year basis, inventory is up 8.8%, a sharp slowdown from the roughly 33% growth peak recorded in 2025.
The deceleration in inventory growth changes the supply narrative heading into spring. As year-over-year comparisons become more difficult in the coming months, even modest listing growth could produce tighter market conditions than many anticipated late last year.
“Inventory growth, which peaked at 33% in 2025, is now below 9% year over year. The year-over-year comps will get harder as we head into spring.”
Pricing signals remain firm
Despite slower weekly activity, pricing metrics continued to improve. Homes with price cuts accounted for 32.2% of listings, below last year’s level of 33.0%, extending a trend of negative year-over-year price-cut data. At the same time, the MAI rose to 35.9, reinforcing seller-leaning national conditions.
The combination of moderating inventory growth and improving price-cut share indicates that supply and demand remain relatively balanced beneath the short-term volatility. Mortgage rates near 6% continue to provide a stabilizing effect.
Regional markets show varying degrees of resilience
Snow Belt metros
New York metro
- Inventory: 12,222 (down 3.2% week over week, up 0.3% year over year)
- New listings: 1,148 (up 8.0% week over week, down 22.2% year over year)
- MAI: 43.3
- Price cuts: 18.8%
Chicago metro
- Inventory: 7,672 (down 1.1% week over week, down 3.0% year over year)
- New listings: 789 (up 19.0% week over week, down 9.0% year over year)
- MAI: 43.1
- Price cuts: 26.2%
Detroit metro
- Inventory: 6,605 (down 2.2% week over week, up 20.6% year over year)
- New listings: 573 (up 11.0% week over week, up 8.1% year over year)
- MAI: 45.0
Several northern metros continue to show strong seller-leaning conditions and relatively low price-cut shares, indicating sustained buyer competition despite weather-driven volatility.
Southern markets
Houston
- Inventory: 31,347 (up 0.1% week over week, up 16.9% year over year)
- New listings: 1,882 (up 14.3% week over week, down 0.6% year over year)
- MAI: 29.1
Dallas-Fort Worth
- Inventory: 23,909 (down 1.0% week over week, up 3.5% year over year)
- New listings: 1,394 (down 1.5% week over week, down 26.1% year over year)
- MAI: 33.6
Miami
- Inventory: 15,167 (down 0.9% week over week, down 3.1% year over year)
- New listings: 1,096 (down 3.5% week over week, down 13.5% year over year)
- MAI: 35.0
Southern markets remain more balanced overall, with higher inventory levels in some metros creating greater pricing sensitivity compared to tighter northern markets.
State-level trends
- Texas leads the nation in inventory with 117,049 homes but saw a 10.9% year-over-year decline in new listings.
- Florida, the second-largest inventory state with 92,312 homes, recorded a 10.8% year-over-year drop in new listings.
- California continues to post strong seller conditions (MAI 46.7) and one of the lowest major-state price-cut rates (24.6%).
Outlook heading into spring
The late-January snowstorm clearly disrupted weekly activity, particularly in listings and contracts. However, slowing inventory growth, improving price-cut share and steady mortgage rates suggest the underlying structure of the housing market remains stable.
The pace at which new listings recover will determine whether this episode registers as a brief winter interruption or the beginning of a more constrained spring supply environment.
For deeper context on rates, demand signals and the macro backdrop shaping early-2026 housing activity, read HousingWire’s Housing Market Tracker weekly analysis. HousingWire used HW Data to source this story. This article is based on single-family residence data through Feb. 6, 2026. The Market Action Index (MAI) measures the balance between supply and demand, with higher readings indicating stronger seller leverage. To see what’s happening in your own local market, generate housing market reports. For enterprise clients looking to license the same market data at a larger scale, visit HW Data.